My Final Project
Final project template for the GEO511 class
Amanda Waggoner
Introduction
Brooklyn, NY is one of the major boroughs of New York City, NY. Known for its diverse populace, art and music scene, the borough has become a hub for many to live and explore the area. In the mid-1830s to the beginning of the 1900s, Brooklyn was a hub for many immigrants to start their lives together. A multicultural melting pot, just like the rest of New York City, Brooklyn contained Blacks, Asians, Latinos, and European migrants within its boundaries. However, New York City’s demography shifted with the rise of the industrial revolution and the impacts of World Wars I/II. Economically, many shipping and manufacturing industries left the city as a whole, causing crime, job losses, and people moving out from the city (Freudenheim 14).
Because of these shifts, throughout the 1950s, 60s and 70s, Brooklyn kept declining in population. However, immigration ensued as people from other countries kept coming to America to find new ways of life. Brooklyn began to return back to its original prowess in the mid-1980s, as parks, buildings, homes, etc. were revitalized by wealthier patrons moving into the area. Gentrification ensued, and urban renewal policies began to take foot in many neighborhoods within Brooklyn. From the 1980s onward, toward the new millennium, Brooklyn began to become further and further gentrified and was dubbed one of the “most desirable places to live” during the 2010s (Freudenheim 14).
How did these changes impact the Black communities living within Brooklyn? Initially, during the late 1800s, as freed slaves began to escape and live towards the north, Black populations rose in many urban areas like Philadelphia, Washington, D.C., and other cities across the United States. New York was another city where freed Blacks lived and escaped towards, and similar to Harlem, Brooklyn was another location within New York City where Blacks felt safe to establish community in. Because of the community that Blacks established in Brooklyn, many types of businesses: (churches, restaurants, schools, nightlife, etc.), were established for and by Black Brooklynites.
As time progressed, closer to the new millennium, white gentrifiers replaced and outnumbered the Black populace of Brooklyn. Many formerly majority Black neighborhoods within Brooklyn were becoming increasingly more populated by “upper-class whites” (Chronopoulos 2020). Because of these changes, many Black Brooklynites felt displaced and removed from the communities they established and created, feeling as if their legacies were being removed from the neighborhoods they inhabited. Gentrification not only displaced Black inhabitants from their homes but also displaced Black Brooklynites from their businesses and general sense of community (Valli 2016).
Materials and methods
In order to accomplish my findings, I ended up creating an application through Yelp’s API for Developers. That application was the basis for my API Key and search conditions that I used to apply to my code. Then, within my code, I added sections where I could apply specific terms for my search parameters. (This will be demonstrated within my code chunks below.) I ended up focusing on the search term, “African-American”, and then looking for categories applicable to nightlife, such as, “bars, venues”, etc.
Data: The data that I used to create maps were all open-source data. Ggplot2 and Leaflet were my main sources of map creation. I installed the packages and created maps based on the data points I extracted from my Yelp search. However, my biggest issue that I need help with is pulling the coordinate data directly from my Yelp search onto my map. Secondly, I also added Census data in order to map out where the venues where in correlation to the racial atmosphere of Brooklyn.
Challenges: When I was creating my map, I pulled the data from Yelp into a separate .csv file and then re-loaded it into R. However, the data was not fully reading, so in order to accomplish this first draft, I manually added Markers and Popups as points onto my map. I would like assistance in remedying this issue, by directly have all of the information that Yelp pulls from its search into my Markers as Popup information.
library(tidyverse)
library(leaflet)
library(kableExtra)
library(sf)
library(dplyr)
library(jsonlite)
library(ggplot2)
library(leaflet)
library(htmltools)
library(spData)
library(mapview)


# Load yelpr package
library(yelpr)

#Load in tidycensus package
library(tidycensus)

# Assign Yelp App Key
key <- Sys.getenv("YELP_API_KEY")
#key <-  "ovIH-U3kauQ5ikHV5951RqsOq81q4MycWiu5xIsFCzd_c2zKxAwUdhb-SDvOeJ9Wrp_3rSVS3z5PuQDqfbl9grNOI3SFeHsOViv2eXZMnus6NlYyWs3gURZP_m-UYXYx"

#Assign Census App Key
census_api_key(Sys.getenv("CENSUS_API_KEY"))
#census_api_key("f48d3af8bc5fffac768182aef551a3d3841a4ae8", overwrite= TRUE, install= TRUE)

#Search for races in Brooklyn, NY using 2020 Census Data
racevars <- c(White = "B02001_002",
              Black = "B02001_003",
              Asian = "B02001_005",
              Hispanic = "B03002_012")

options(tigris_use_cache = TRUE)
brooklyn <- get_acs(geography = "tract", year = 2018, variables = racevars,
                  state = "NY", county = "Kings County", geometry = TRUE, cache_table=T)


# Search businesses with keyword 'black' in 'Brooklyn, New York'
business_bk <- business_search(api_key = key,
                               location = 'Brooklyn, NY',
                               term = "African American",
                               categories = 'venues, bars, African',
                               limit = 50)

business_bk_spatial <- business_bk$businesses %>% as.data.frame() %>%
  jsonlite::flatten(recursive = TRUE) %>% unnest(cols="coordinates.latitude") %>%
  st_as_sf(coords=c("coordinates.longitude", "coordinates.latitude"))
business_bk_spatial<-business_bk_spatial %>% mutate(popup=paste0("<br/><b><a href='",url,"'>",name,"</a></b><br>",location.address1))

# Transform the business_bk_spaital data into a different coordinate system
business_bk_spatial <- business_bk_spatial %>% st_set_crs(4326) %>% st_transform(crs=st_crs(brooklyn))

knitr::opts_chunk$set(cache=TRUE)  # cache the results for quick compiling
Results
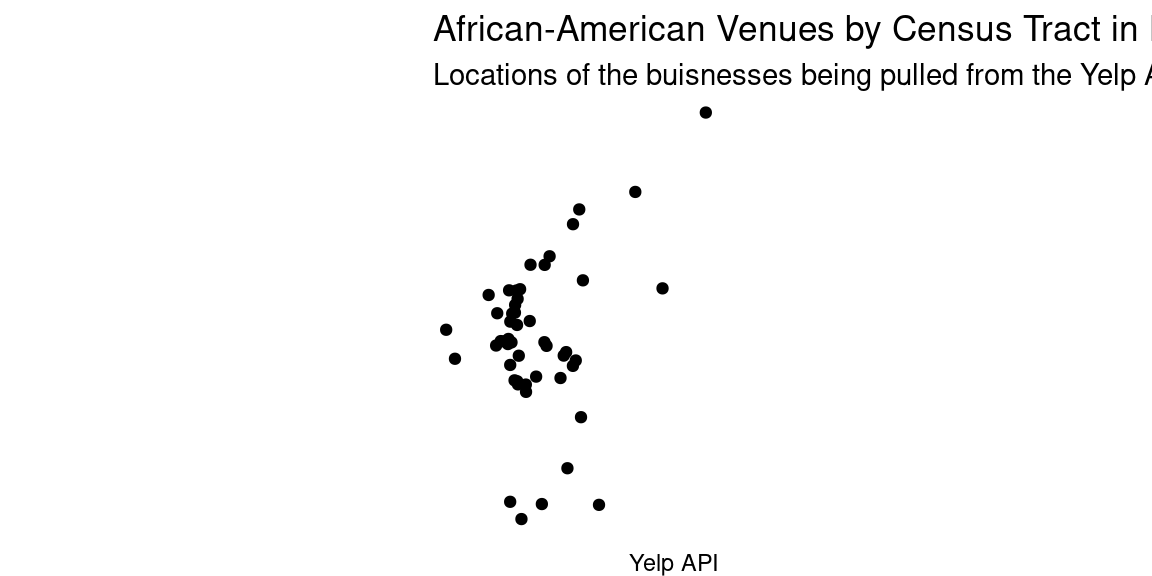
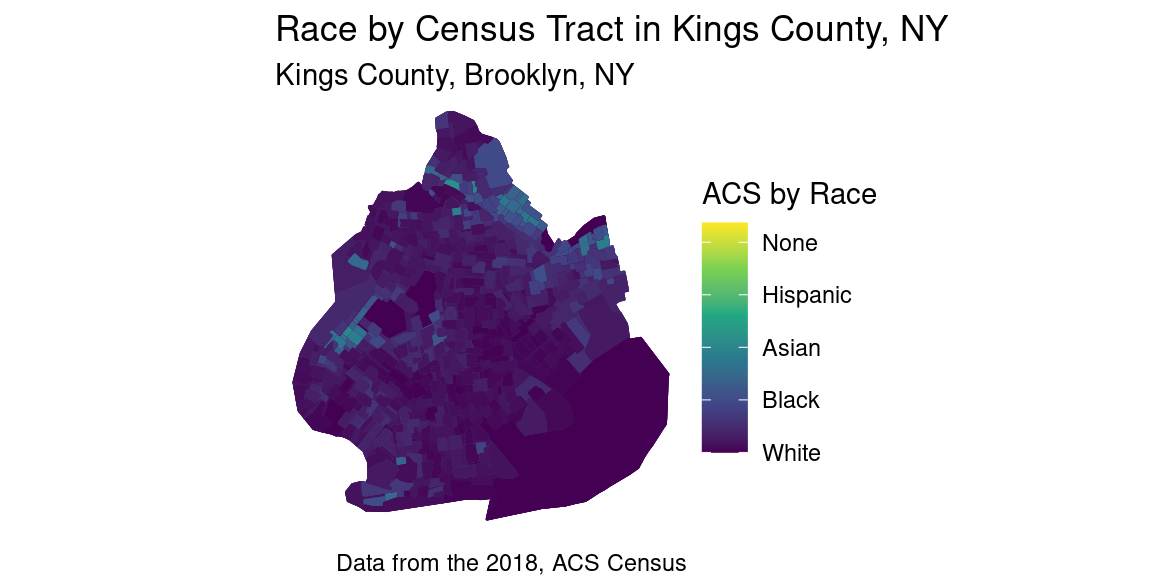
In terms of results, I’ve generated three different for the purposes of this project. The first map is just showing the location of Brooklyn, NY in New York state. The location of Brooklyn is broken down into several racial categories by census tract. The second map shows the African-American business overlaid ontop of racial data by census tract. The second map is showing the results of my Yelp API search with the names as Popups. However, I want to fix this and layers of information as clickable popups to the data. For example, I want to add Markers with the business’ URL links, information, and other facts.
# Mapping the data extracted from the Yelp Fusion API
# Plot of Yelp data
ggplot(business_bk_spatial)+geom_sf() + theme_void()+
  labs(title = "African-American Venues by Census Tract in Brooklyn, NY",
       subtitle = "Locations of the buisnesses being pulled from the Yelp API in Brooklyn, NY",
       caption = "Yelp API"
       )
Map of Brooklyn and African-American Brooklyn Music Venues/Nightlife
# Plot of Census data
ggplot(brooklyn, aes(fill = estimate, color = estimate)) +
  geom_sf() +
  scale_fill_viridis_c(labels = c("White", "Black", "Asian", "Hispanic", "None")) +
  scale_color_viridis_c(guide = "none") +
  theme_void() +
  labs(title = "Race by Census Tract in Kings County, NY",
       subtitle = "Kings County, Brooklyn, NY",
       caption = "Data from the 2018, ACS Census",
       fill = "ACS by Race"
       )
Map of Brooklyn and African-American Brooklyn Music Venues/Nightlife
# Plot of African-American Venues over census data
ggplot(brooklyn, aes(fill = estimate, color = estimate)) +
  geom_sf() +
  scale_fill_viridis_c(labels = c("White", "Black", "Asian", "Hispanic", "None")) +
  scale_color_viridis_c(guide = "none") +
  theme_void() +
  labs(title = "African-American Music Venues Over Racial Census Tracts in Kings County, NY",
       subtitle = "Kings County, Brooklyn, NY",
       caption = "Data from the 2018, ACS Census",
       fill = "ACS Census Tracts by Race") +
geom_sf(data = business_bk_spatial, inherit.aes = F) 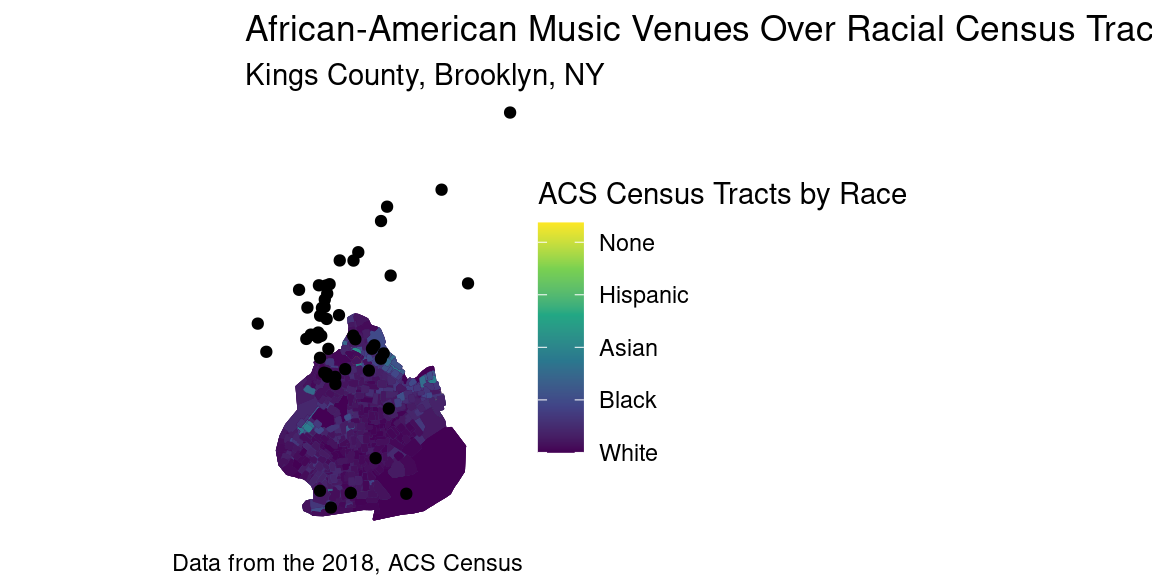
Map of Brooklyn and African-American Brooklyn Music Venues/Nightlife
# Create a map of African-American businesses in Brooklyn, NY from the Yelp API


# Select different basemaps
business_bk_spatial %>%
  leaflet() %>%
  addProviderTiles(providers$Esri.WorldImagery, group = "World Imagery") %>%
  addProviderTiles(providers$Esri.WorldStreetMap, group = "World Street Map") %>%
  addLayersControl(baseGroups = c("World Imagery","World Street Map")) %>%
  # Add the businesses as Markers
  addCircleMarkers(fillOpacity = 0.5, popup = ~popup)%>%
 setView(lat = 40.650002, lng =-73.949997, zoom = 9.5)
## Warning: sf layer has inconsistent datum (+proj=longlat +datum=NAD83 +no_defs).
## Need '+proj=longlat +datum=WGS84'Map of Brooklyn and African-American Brooklyn Music Venues/Nightlife
Conclusions
From what I have analyzed, there are less African-American music venues in white areas of Brooklyn. The areas that these venues tend to be more centralized in Black areas of Brooklyn. Because of this, I believe that gentrification has played a role in which Black venues are still open within Brooklyn. However, for this analysis to be more accurate and more in-depth, I’d like to examine Black venues over time, rather than just examine venues that are open as of now.
References
- https://github.com/OmaymaS/yelpr
- https://www.yelp.com/profile?fsid=gLo385y0jkTIMh1kCXgjjw
- https://towardsdatascience.com/making-interactive-maps-in-r-with-less-than-15-lines-of-code-bfd81f587e12
- http://remi-daigle.github.io/GIS_mapping_in_R/
- https://rstudio.github.io/leaflet/markers.html
- https://map-rfun.library.duke.edu/01_georeference.html
- “What’s Happened to the People?” Gentrification and Racial Segregation in Brooklyn - Themis Chronopoulos
- The Brooklyn Experience: The Ultimate Guide to Neighborhoods & Noshes, Culture & the Cutting Edge - Ellen Freudenheim
- Artistic careers in the cyclicality of art scenes and gentrification: symbolic capital accumulation through space in Bushwick, NYC - Chiara Valli